



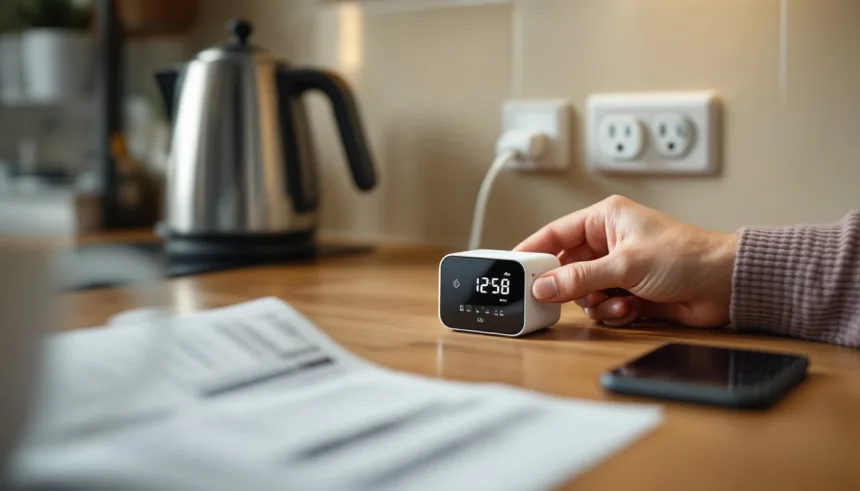
If you’ve just received a smart meter in-home display or bought your first smart plug, you’re holding a tool that can cut your electricity bill, but only if you know what to look at and what to do next. This smart energy monitor beginner guide for UK homes walks you through seven practical steps: how to read the numbers on your display, which appliances cost the most to run, and a simple 30-day plan to turn real-time data into measurable savings.
- Smart energy monitor beginner guide UK basics
- Smart energy monitor beginner guide UK
- Set up your monitor and smart plugs in 20 minutes
- How to read the main screens and numbers
- Find energy-wasting appliances in one weekend
- Turn data into a 30-day bill-cutting plan
- Off-peak tariffs, EVs and smart home upgrades
- If your smart meter or monitor looks wrong
- Frequently Asked Questions
- How do I read my smart meter monitor?
- What to do if you think your smart meter is wrong?
- What is the first step in smart energy monitor beginner guide UK?
- How do homeowners know whether smart energy monitor beginner guide UK is worth it?
- What mistakes should homeowners avoid with smart energy monitor beginner guide UK?
Whether you’re in a rented flat in Manchester or own a house in Kent, the process is the same, and the potential savings, typically £50 to £150 a year for an average household, are within reach once you understand what your monitor is telling you. You don’t need technical expertise or expensive equipment.
Smart energy monitor beginner guide UK basics
This smart energy monitor beginner guide UK starts with one idea: you only cut your electricity bill when you can actually see what’s wasting power. A smart energy monitor is any device that shows your real-time energy use in pounds or kilowatt hours (kWh), often down to individual appliances, so you can spot and kill waste quickly.
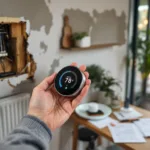
There are three main bits to understand. First, the smart meter itself (installed by your supplier) measures total household use and sends readings automatically, but it usually sits in a cupboard. Second, the in-home display (IHD) is the small screen that talks to the smart meter and shows live cost per hour, today’s spend, and sometimes usage by time of day. Third, third-party monitors and smart plugs sit between the wall and specific appliances (like a tumble dryer or gaming PC), measuring exactly what each uses and often letting you switch them off remotely or set schedules.
For a typical UK home, simply using the IHD and two or three smart plugs on the worst “always on” devices (old fridge-freezer, TV/console stack, office kit) can realistically shave around 5-10% off electricity use by revealing and then cutting standby and inefficient habits. In Germany, where unit prices are often higher, the same kWh savings can translate into similar or slightly larger euro savings, especially for high-consumption apartments with electric heating or multiple fridges.
Related internal resource Nest vs tado Germany comparison.
Smart energy monitor beginner guide UK
If you want a smart energy monitor beginner guide UK readers can actually act on, start by deciding whether you need a free supplier in-home display (IHD), a paid whole-home monitor, or just a few smart plugs. The right choice depends on whether you care more about total daily spend, always-on “phantom” loads, or fine-grained control of individual appliances.
| Option | Typical cost | Best for | Key drawback |
|---|---|---|---|
| Supplier IHD | Usually free | Whole-home overview | Limited detail & control |
| 3rd-party monitor | £70-£250 | Detailed usage data | Higher upfront cost |
| Smart plugs | £10-£25 each | Individual devices | Only what’s plugged in |
In the UK, most major suppliers provide an IHD when they install a smart meter. These show real-time kWh, estimated daily cost, and tariff info; they’re enough for many beginners to see which times of day cost most. Guidance from organisations like Citizens Advice focuses on learning your “normal” usage first, then spotting spikes. Drawbacks: IHDs don’t identify specific appliances, usually can’t control anything, and older displays may not work if you switch supplier or move to a time-of-use tariff.
Third-party whole-home smart energy monitors (often clamp-on sensors in your consumer unit) add app dashboards, better graphs, and sometimes per-appliance pattern detection. Expect roughly £70-£120 for basic models, £150-£250 for systems with solar tracking or smart-home integrations. Check they support UK 230V/50Hz, your fusebox layout, and your smart meter model. Some may need an electrician. In Germany, panel layouts and regulations differ, so look for EU-market CE-marked versions and, where required, professional installation.
Smart plugs are the simplest way to turn monitoring into bill savings. Choose models with built-in energy metering, a decent app, and, ideally, Matter or at least Alexa/Google compatibility. They are UK-socket specific, so Germany will need Schuko versions.
Related internal resource do smart thermostats save money UK.
Set up your monitor and smart plugs in 20 minutes
You can get from box to working setup in about 20 minutes if you do things in the right order. This walkthrough keeps it simple for a first smart energy monitor and smart plug, and works for most UK suppliers and typical German setups with small tweaks.
1.
- Put the in-home display (IHD) or monitor somewhere you actually look: kitchen counter, hallway table, or near the front door, away from sinks and hobs.
- Plug it into a standard socket and switch on. Don’t use an extension already overloaded with appliances.
2.
- UK smart meter: Many supplier IHDs (British Gas, Octopus, EDF, etc.) arrive pre-paired. If the screen shows your tariff and live kW within 5-10 minutes, you’re done. If it doesn’t, follow the on-screen “connect” wizard or your supplier’s app, and keep the monitor within a few metres of the smart meter while pairing. If nothing appears after 30 minutes, contact your supplier to “link” the IHD to your meter, as advised by Citizens Advice smart meter guidance.
- Clamp-style monitor (common in Germany or for older UK meters): Clip the sensor around the live cable tail coming out of the meter (never open sealed covers). The sensor should fully close around the cable; avoid extension leads or appliance cords. Power the transmitter (usually batteries) and wait for the base unit to find it.
3.
- Install the manufacturer’s app on your phone.
- Use the app to add a new device; when asked, press the “pair” or “Wi-Fi” button on the monitor.
- Choose your 2.4GHz Wi-Fi network (many smart devices don’t support 5GHz) and enter the password carefully. If you have a combined hub, stand close to it during setup.
- In the app, check the unit rate (p/kWh) and standing charge match your latest bill. If the monitor doesn’t pull this from your supplier automatically, enter it manually.
- For time-of-use or off-peak tariffs, add peak/off-peak rates and times so savings from smart plugs show correctly.
- Choose one easy, high-use appliance first: e.g., TV setup, dehumidifier, or a freestanding heater, under the plug’s rated load (usually 13A in the UK, 10-16A in Germany).
- Plug the smart plug into the wall, then the appliance into the smart plug, and leave the appliance’s own switch “on”.
- In the same app (or the plug’s app, if separate), tap “add device” and follow the instructions, usually holding the plug’s button until its light flashes, then giving it a room and name like “TV corner”.
- Check the app shows instant power use (W) for the smart plug; compare to the overall monitor reading to see the impact.
How to read the main screens and numbers
Your smart energy monitor is the quickest way to see what’s costing you money right now. Once you can read the main screens, it becomes a simple smart energy monitor beginner guide UK tool rather than a confusing gadget.
| Screen/term | What it shows | Why it matters |
|---|---|---|
| kW / kWh | Power now / energy used | Helps spot big users |
| £/hour | Cost per hour now | Shows instant impact |
| Daily/weekly | Total kWh and £ | Tracks habits over time |
| Traffic lights | Green, amber, red use | Quick “too high?” check |
| Budget view | Use vs target spend | Warns before bill spikes |
On the “now” screen, kW (or kWh/hour) tells you how hard your home is pulling on the grid at this moment; £/hour converts that into a live cost. Turn a tumble dryer or fan heater on and watch £/hour jump; switch it off and the drop shows the true running cost. For gas, you may see kWh or m³ instead, often updating more slowly because boilers cycle on and off.
Daily and weekly totals show how much electricity and gas you actually used, in kWh and pounds. This is where real bill cutting happens: compare quiet days to laundry or heating-heavy days, then aim to copy the cheaper patterns. Traffic-light indicators are just shortcuts: green is low background use, amber means “some big stuff is on”, and red usually means heating, hot water, or several heavy appliances together.
Find energy-wasting appliances in one weekend
You can treat one weekend as a mini audit: use your in-home display plus smart plugs to see exactly which appliances blow up your real-time wattage. This works whether you’ve just had a smart meter fitted or you’re following a smart energy monitor beginner guide UK homeowners often get from their supplier.
First, get a baseline. Turn everything off that you reasonably can (lights, TV, PC, tumble dryer, extra fridges). Check the in-home display; whatever’s left is your background load. Now turn appliances on one by one and watch how many watts the number jumps by. A 2,000 W tumble dryer running for 1 hour on a 30p/kWh tariff costs about 60p per cycle; three loads a week is roughly £7/month. An old 150 W drinks fridge left on 24/7 uses about 108 kWh/year, around £32/year at 30p/kWh.
Use smart plugs on likely culprits: TV/console stack, PC setup, dehumidifier, portable electric heater. Most smart plugs show daily and monthly kWh, so you can compare a “normal” week with a stricter week (for example, no electric heater, or TV fully off instead of standby). If a plug shows 20 W standby on a media setup, that’s 0.02 kW × 24 h × 365 ≈ 175 kWh/year, about £52.
Run through this quick-win checklist:
- Unplug or timer-control spare fridges and freezers.
- Dry clothes on an airer whenever possible; cut tumble cycles.
- Kill standby on TVs, set-top boxes and consoles via smart plugs.
- Limit electric heaters to short, scheduled bursts only.
- Use the monitor for a week to confirm your “new normal” is clearly lower than your baseline.
Turn data into a 30-day bill-cutting plan
Raw data from your smart energy monitor means nothing until you turn it into a concrete action plan. Start by reviewing your first week of readings to identify your baseline: note your daily kWh consumption and the times when usage spikes. Most UK households average 8-10 kWh per day; if you’re significantly above that, you have clear room to cut costs.
Set a realistic 30-day target: aim to reduce consumption by 10-15% in the first month. For a household using 300 kWh monthly, that’s 30-45 kWh saved, worth roughly £9-14 at current UK rates. Break this into weekly mini-goals: if you need to save 10 kWh per week, focus on one high-drain appliance or habit each week (tumble dryer, standby devices, heating schedules).
Use your monitor or app to set budget alerts. Configure a daily kWh cap slightly below your baseline average; when you approach it, the alert prompts immediate action, switch off non-essentials, delay the dishwasher, or adjust the thermostat. This real-time feedback loop is far more effective than reviewing bills weeks later.
Track progress in a simple spreadsheet or note app: log daily kWh, note any changes you made (“unplugged games console,” “shorter showers”), and watch the trend line. Good improvement looks like a steady 2-3% weekly drop without major lifestyle sacrifice. If savings stall after two weeks, revisit your monitor data to find the next biggest energy drain and tackle that.
Off-peak tariffs, EVs and smart home upgrades
Off-peak and smart tariffs only save money if you can actually shift usage. A smart energy monitor lets you see when your home is drawing power, while smart plugs move flexible loads, like dehumidifiers, washing machines or chargers, into cheap-rate windows without guesswork.
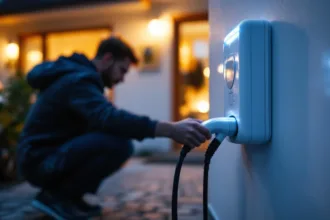
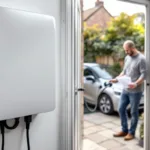
With EVs, the basic version is using the monitor plus your supplier app to confirm your car really charges in off-peak slots. Add a compatible smart charger, and you can schedule around your tariff automatically; combine that with smart plugs on other appliances and you stack multiple small shifts into one bigger nightly saving.
Dynamic tariffs in the UK and Germany (where prices can change hourly) reward people who can react quickly. A smart energy monitor beginner guide UK readers can use in practice is: watch when prices drop in your supplier app, then use schedules or scenes so smart plugs, immersion heaters, and battery storage all run harder in those cheap hours and back off when prices spike.
| Setup | Effort | Typical bill impact | Who it suits |
|---|---|---|---|
| Off-peak, no smart kit | High | Small to moderate | Highly disciplined users |
| Monitor only | Medium | Moderate | People learning patterns |
| Monitor + smart plugs | Medium | Moderate to high | Homes with big devices |
| Monitor + EV charger | Medium | High on off-peak | EV owners |
| Full smart home + AI | Low | Highest long term | Tech-comfortable households |
If your smart meter or monitor looks wrong
Smart energy monitors in the UK and Germany are usually accurate enough for day-to-day tracking, but they are not legal billing devices. Bills are based on the smart meter itself, not the in-home display (IHD) or app. If your smart energy monitor looks wrong, start by separating three things: the meter reading, the monitor’s live usage number (kW), and the cost estimate (£/€).
Do some quick checks before calling your supplier:
- Compare the smart meter’s physical display reading (kWh) with your latest bill, they should broadly match over time.
- Turn everything off at the consumer unit except one known appliance (e.g. a 1 kW heater) and see if the monitor shows roughly 1 kW.
- Check tariff settings in the IHD/app, wrong unit rates, standing charges, or day/night times will make costs look wrong even if kWh is right.
- Make sure the monitor is paired to the correct meter and has a good signal (no “waiting for data” icons, no long dropouts).
Frequently Asked Questions
How do I read my smart meter monitor?
Start with the Home or Menu button, then select Electricity. Choose “Now” or “Instant” to see live usage, usually shown as £/hour and kW.
Use Fuel or Settings to switch between electricity and gas. Select “Today” or “So far today” for today’s total cost.
What to do if you think your smart meter is wrong?
First, log daily meter readings and costs from your smart energy monitor for at least a week, plus photos of the meter itself. Then run a simple test: switch everything off, turn on one high-load appliance (like a kettle or heater) for 10-15 minutes, and note usage.
What is the first step in smart energy monitor beginner guide UK?
The best first step is to plug in and position your in-home smart energy monitor where you actually sit in the evening, then set it to show live £/hour.
How do homeowners know whether smart energy monitor beginner guide UK is worth it?
Track two numbers: your average daily electricity cost before you start using your monitor actively, and the average after four weeks of adjusting habits or smart plugs. If you can cut 5-10% without feeling colder or deprived, it’s working.
What mistakes should homeowners avoid with smart energy monitor beginner guide UK?
Avoid chasing tiny standby savings while ignoring big loads like heating, hot water, ovens, and tumble dryers. Don’t hide your smart energy monitor in a drawer where no one sees it.
Avoid buying lots of smart plugs before you know which appliances actually cost most.
Your smart energy monitor beginner guide journey doesn’t end when you finish reading, it starts when you plug in your first device, check the display, and make one small change. The seven steps in this guide give you a repeatable framework: measure, identify the biggest consumers, test one change at a time, and track the result over a billing cycle.
Real savings come from consistent habits, not one-off actions. Set a monthly reminder to review your kWh totals, compare them against your bill, and adjust.
Whether you’re using a free in-home display in the UK or a smart plug setup in Germany, the principle is identical: visibility drives behaviour, and behaviour drives savings.